Archive for the ‘Kamloops Real Estate Statistics’ Category
Wednesday, June 14th, 2017
Median Residential House Price $437,900 up 2% from April 2017
Residential units May 2017 sold up 14% from April 2017
Average Days on the Market May 2017 33 days down 29% from April 2017
Most active areas in Kamloops were Aberdeen, Sahali and Brocklehurst
Most active price range
$320,000 – $359,900 46 sales
$360,000 – $399,900 34 sales
$400,000 – $439,900 35 sales
$600,000 plus 43 sales
Tags: buyer, buying, housing, kamloops real estate, Kamloops realtor, linda klein, market, monthly, mortgage, real estate tips, realtor, statistics, trends
Posted in Kamloops Real Estate Statistics | Comments Off on Monthly Kamloops Real Estate Stats for May 2017
Wednesday, March 1st, 2017
February 2017 Activity
Kamloops only Median Residential Price: (does not include condominiums or mobiles) $397,500
Most active price range
$320,000 – 359,999 29 sales
$360,000 – 399,999 22 sales
$400,000 – 439,999 17 sales
Most active area
Aberdeen 21 sales
South Kamloops 18 sales
Sahali 17 sales
Brock 16 sales
Tags: buyer, estate, home buyer, kamloops, kamloops real estate, Kamloops realtor, linda klein, listings, market, real estate tips, realtor
Posted in Kamloops Real Estate Statistics | Comments Off on Kamloops Real Estate Sales February 2017
Friday, February 17th, 2017
Kamloops is continuing to counter province wide trends for real estate, at least for now.
Home sales in B.C., driven by the sagging Lower Mainland market, fell by 23 per cent from the same time last year. The Kamloops region, however, saw an increase in sales of five per cent compared to January last year.
Cameron Muir, chief economist for B.C. Real Estate Association, said some markets are going against the grain.
“Housing demand across the province returned to long-term average levels last month,” he said in a statement.
“However, regional variations persist, with Victoria posting above average performance and Vancouver falling below the average.”
At the same time, the average price on the multiple listing service (MLS) declined by 17.5 per cent. Kamloops and District Real Estate Association estimated the average sale price for a residential detached home within the city in January was $410,000, a number that is stable. Numbers do vary from month to month due to price range of homes sold but has stayed over $400,000 since last year .

Tags: buyer, improvements, kamloops real estate, Kamloops realtor, linda klein, listings, market, Real estate, real estate tips, realtor, statistics, trends
Posted in Buying a Home, Kamloops Real Estate Statistics, Real Estate News | Comments Off on New Construction of multi family units
Sunday, September 11th, 2016
Comparing August 2016 to August 2015
Comparative Statistics for Kamloops (Residential Only)
| |
August
2016 |
August
2015 |
|
| Number of New Listings |
429 |
392 |
UP 9.44%
|
| Residential Units Sold |
362 |
264 |
UP 37.12% |
| Avg. Days on Market |
53 |
60 |
DOWN 11.6% |
| List to Sell Price Ratio |
98.18% |
97.22% |
UP 0.99%
|
| Median
Residential Price |
$419,00 |
$378,000 |
UP 10.85%
|
| Total Monthly Sales $$ |
$127,636,731 |
$83,952,683 |
UP 52.03% |
| Active Listings |
1708 |
2042 |
DOWN 16.3% |
*The above information is from sources deemed reliable but it should not be relied upon without independent verification.
Tags: buyer, home buyer, house, kamloops real estate, Kamloops realtor, linda klein, monthly, Real estate, real estate tips, realtor, statistics, trends
Posted in Kamloops Real Estate Statistics | Comments Off on Kamloops Real Estate Statistics for August 2016
Monday, June 6th, 2016
The city’s real-estate market shows no signs of slowing, with recent numbers indicating residential sales jumped by a third compared to the same month last year.
Statistics from the Kamloops & District Real Estate Association show sales in May were up 36 per cent over last year.
This comes at the same time as supply continues to shrink. The number of listings compared to 2015 is down 15 per cent.
Cyndi Crossley, vice-president of the real-estate board, said the market is being driven by out-of-town buyers.
“In Kamloops, we are seeing buyers coming from the Lower Mainland, and understandably so, due to the sale prices and our affordable housing,” she said.
The B.C. Real Estate Association cites positive employment growth for the trends.
“They say we could see the stats continue as they are for approximately the next eight to 12 months,” Crossley said.
The median price for a single-family home in Kamloops is $405,000. That is influenced in part by 20 homes selling for more than $600,000 in May.
Tags: buying, estate, home, home buyer, houses, improvements, kamloops, kamloops real estate, Kamloops realtor, linda klein, Real estate, real estate trends, realtor
Posted in Kamloops Real Estate Statistics | Comments Off on Kamloops Real Estate Market Strong, House median price up
Friday, June 3rd, 2016
New data this week confirms that residential real estate continues to boom in British Columbia.
The BC Real Estate Association’s second quarter housing forecast calls for a record 115,200 units to be sold in 2016 through the MLS, that’s up 12.3 per cent year-over-year to break the previous record set in 2005 (105,600).
Prices are set to surge again, up 20.4 per cent to an average MLS price of $766,600. The outlook for 2017 is for a more modest 3.4 per cent increase.
“Record housing demand has depleted inventories in many urban areas, and the resulting imbalance between supply and demand has pushed home prices considerably higher,” commented Cameron Muir, BCREA Chief Economist.
Inventory will be helped by increased construction with BCREA predicting a 20 per cent rise in new housing starts this year.
Tags: buying, estate, home, home buyer, housing, kamloops real estate, Kamloops realtor, linda klein, Real estate, real estate tips, realtor, statistics
Posted in Kamloops Real Estate Statistics | Comments Off on B.C. and Kamloops real estate has limited inventory and lots of demand
Monday, May 16th, 2016
April was another record-breaking month for home sales in British Columbia. There were 12,969 sales through the MLS of BCREA last month, beating March’s 12,560; and up 30.3 per cent from April 2015.
“Housing demand is exceptionally strong across the southern regions of the province,” said Cameron Muir, BCREA Chief Economist. “Consumers appear to be particularly active in the Vancouver Island, the Fraser Valley and the Thompson/Okanagan regions.”
The average MLS price was up 17.2 per cent year-over-year to $743,640 and the total value of all home sales surged 52.7 per cent to $9.64 billion.
Tags: analysis, buy, estate, home buyer, houses, kamloops, kamloops real estate, Kamloops realtor, linda klein, market, real estate tips, real estate trends, realtor, sell
Posted in Kamloops Real Estate Statistics | Comments Off on APRIL WAS A BUSY MONTH FOR B.C. REAL ESTATE
Wednesday, April 6th, 2016
Comparing March 2016 to February 2016
Comparative Statistics for Kamloops (Residential Only)
|
March
2016 |
February 2016 |
|
| Number of New Listings |
520 |
422 |
23.22% UP |
| Residential Units Sold |
256 |
197 |
29.95% UP |
| Avg. Days on Market |
70 |
84 |
16.67% DOWN |
| List to Sell Price Ratio |
97.54% |
97.43% |
0.11% UP |
| Median Residential Price |
$368,000 |
$378,000 |
2.65% DOWN |
| Total Monthly Sales $$ |
$86,693,738 |
$65,085,608 |
33.20% UP |
| Active Listings |
1675 |
1560 |
7.40% UP |
*The above information is from sources deemed reliable but it should not be relied upon without independent verification.
Tags: analysis, estate, houses, kamloops, kamloops real estate, Kamloops realtor, linda klein, market, Real estate, real estate tips, real estate trends, realtor, statistics
Posted in Kamloops Real Estate Statistics | Comments Off on March 2016 Real Estate Statistics Solds up 29% over February
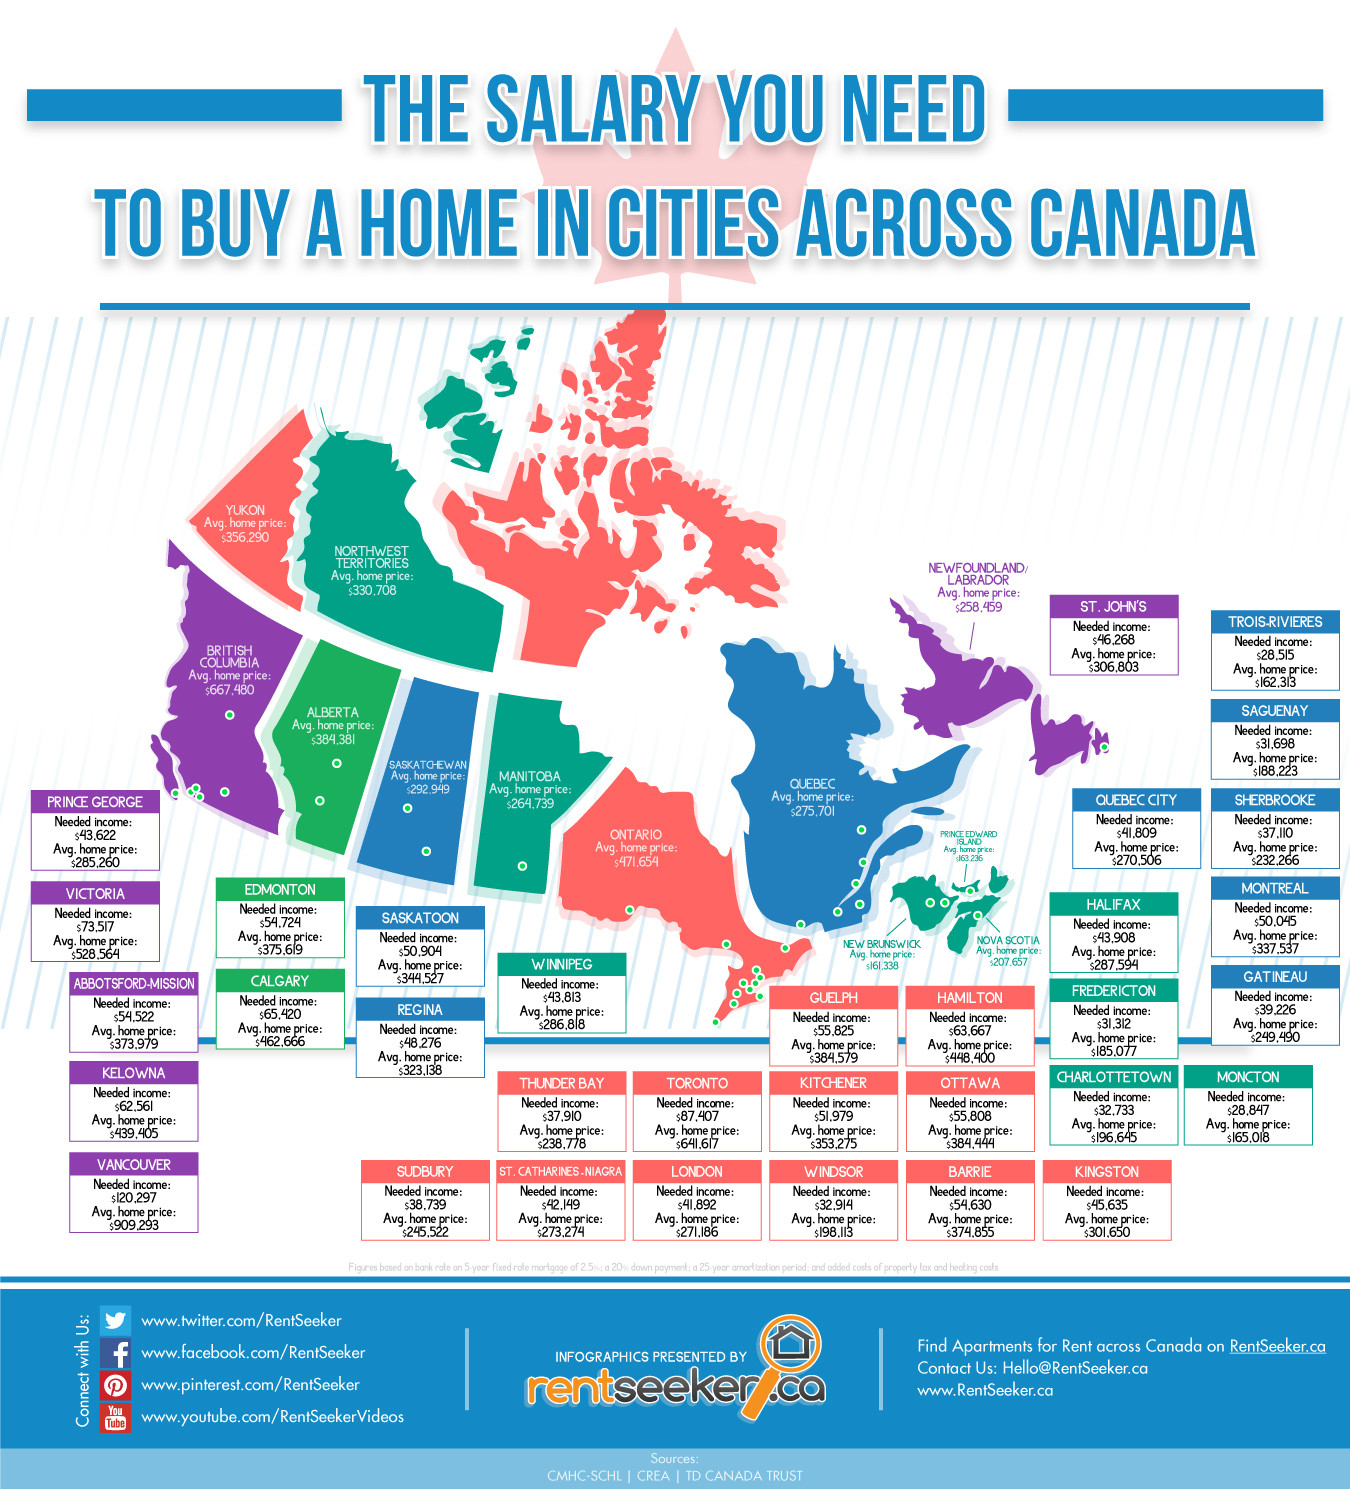
Tuesday, January 26th, 2016
 we are only 3 hours away but so much more affordable, Kamloops a great place to call home.
Tags: estate, home buyer, homes, house, kamloops, kamloops real estate, Kamloops realtor, linda klein, market, Real estate, real estate tips, realtor, trends
Posted in Kamloops events and happenings, Kamloops Real Estate Statistics | Comments Off on The most expensive City is Vancouver
Wednesday, January 14th, 2015
|
December 2014 |
November 2014 |
|
| Number of New Listings |
195 |
267 |
26.97% DOWN |
| Residential Units Sold |
123 |
146 |
15.75% DOWN |
| Avg. Days on Market |
76 |
77 |
1.30% DOWN |
| List to Sell Price Ratio |
96.50% |
97.79% |
1.32% DOWN |
| Median Residential Price |
$344,000 |
$355,000 |
3.10% DOWN |
| Total Monthly Sales $$ |
$39,265,843 |
$42,443,621 |
7.49% DOWN |
| Active Listings |
1569 |
1789 |
12.30% DOWN |
Tags: analysis, estate, kamloops, kamloops real estate, linda klein, market, monthly, news, Real estate, real estate tips, real estate trends, realtor, statistics, trends
Posted in Kamloops Real Estate Statistics | Comments Off on Comparative Statistics for Kamloops December 2014 to November 2014